Other Illustrations:
llustration :
From the following calculate current ratio
Babu Co. Ltd.
Balance Sheet as on 31.3.04
| Liabilities | Rs. | Assets | Rs. |
| Share capital | 21,000 | Fixed Assets | 17,000 |
| Reserves | 4,000 | Stock | 6,000 |
| Bank Overdraft | 2,000 | Debtors | 3,200 |
| Creditors | 6,000 | Cash 6,800 | |
| 33,000 | 33,000 |
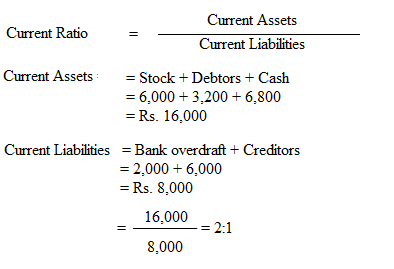
Illustration :
From the following Balance Sheet as on 31.3.2005, calculate current ratio and liquid ratio.
| Liabilities | Rs. | Assets | Rs. |
| Equity share capital | 40,000 | Machinery | 45,000 |
| Profit & Loss A/c | 4,000 | Stock | 22,000 |
| Debentures | 25,000 | Debtors | 19,000 |
| Creditors | 24,000 | Cash | 5,000 |
| Prepaid expenses | 2,000 | ||
| 93,000 | 93,000 |
Solution:
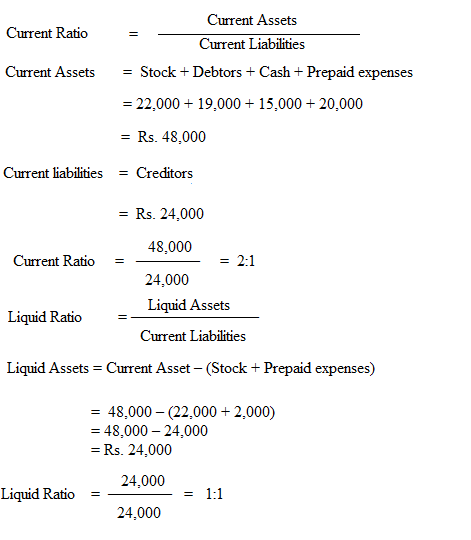
Illustration :
From the following, calculate Debt-Equity Ratio.
| Rs. | Rs. | ||
| Equity shares | 1,00,000 | General reserves | 75,000 |
| Debentures | 75,000 | Sundry creditors | 40,000 |
| Outstanding expenses | 10,000 |
Solution:
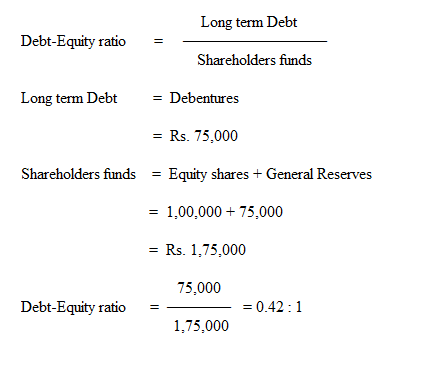
Illustration :
Calculate Gross Profit Ratio from the following:
Rs.
Purchases 2,65,000
Opening stock 10,000
Closing stock 20,000
Sales 3,00,000
Solution:
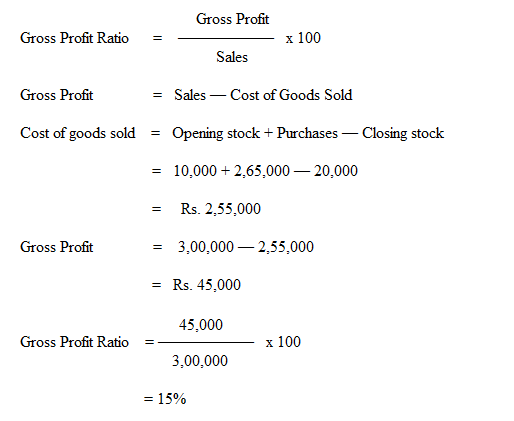
Illustration :
From the following data, calculate the fixed asset turnover ratio.
Rs.
Cash sales 1,00,000
Credit sales 1,20,000
Sales Returns 20,000
Fixed assets 45,000
Depreciation 5,000
Solution:
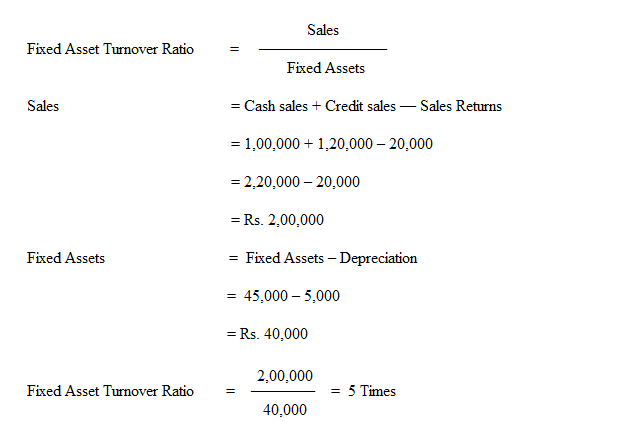
Illustration :
From the following trading account, calculate stock turnover ratio and gross profit ratio.
Trading Account of Mohammed Ali & Co.
for the year ended 31.3.2004
| Particulars | Rs. | Particulars | Rs. |
| To Opening stock | 40,000 | By Sales | 2,00,000 |
| To Purchases | 1,20,000 | By Closing stock | 20,000 |
| To Carriage | 10,000 | ||
| To Gross profit | 50,000 | ||
| 2,20,000 | 2,20,000 |
Solution:
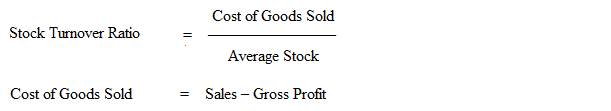
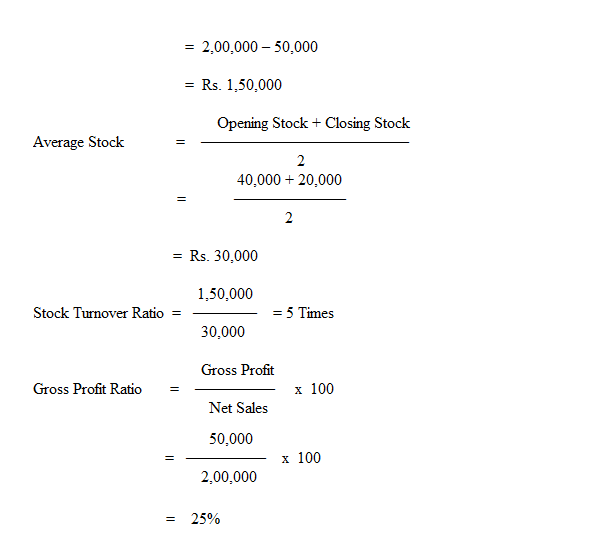
Illustration :
From the following figures calculate creditors turnover ratio
Rs.
Credit purchases 1,80,000
Bills payable 50,000
Creditors 40,000
Solution:
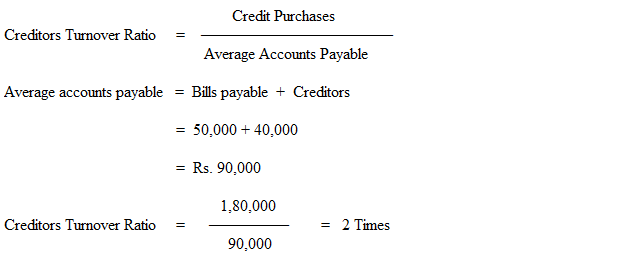
Illustration :
The following is the Trading & Profit and Loss Account of a firm for the year ended 31.3.04.
Trading and Profit and Loss Account of Lilly & Co.
for the year ended 31.3.2003
| Particulars | Rs. | Particulars | Rs. |
| To Opening stock | 35,000 | By Sales | 4,00,000 |
| To Purchases | 2,25,000 | By Closing stock | 50,000 |
| To Wages | 10,000 | ||
| To Gross profit | 1,80,000 | __________ | |
| 4,50,000 | 4,50,000 |
| To Administration expenses | 10,000 | By Gross profit | 1,80,000 |
| To Interest | 5,000 | By Dividend | 2,000 |
| To Loss on sale of machinery | 2,000 | ||
| To Selling expenses | 10,000 | ||
| To Net Profit | 1,55,000 | _________ | |
| 1,82,000 | 1,82,000 | ||
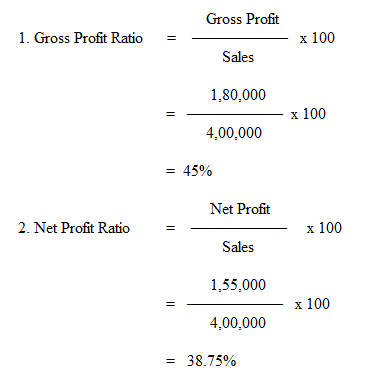
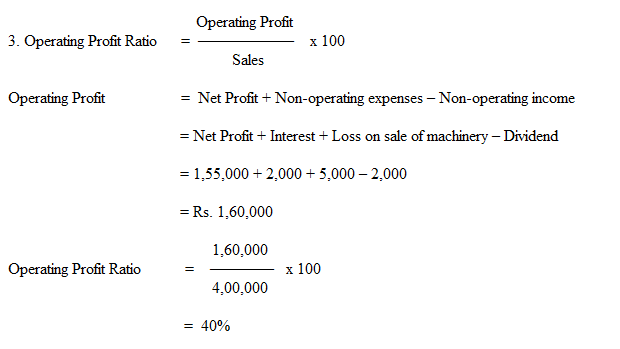
Calculate profitability ratios.
Solution:
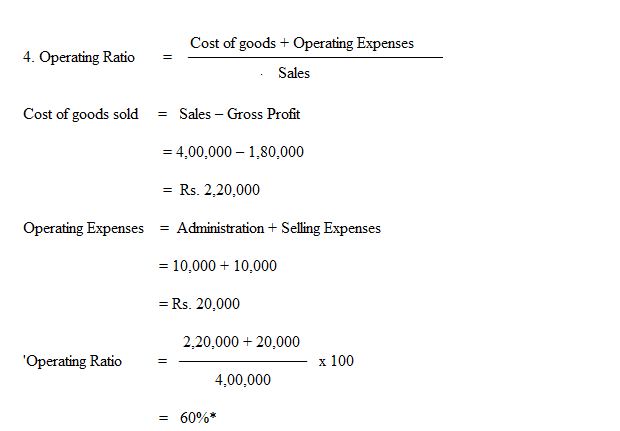
* Note : Operating ratio = 100% –– Operating profit ratio
= 100% –– 40%
= 60%
Illustration :
From the given data, calculate
1. Gross Profit Ratio
2. Net Profit Ratio and
3. Current Ratio
| Rs. | Rs. | ||
| Sales | 3,00,000 | Cost of goods sold | 2,00,000 |
| Net Profit | 30,000 | Current Assets | 60,000 |
| Current liabilities | 30,000 |
Solution :
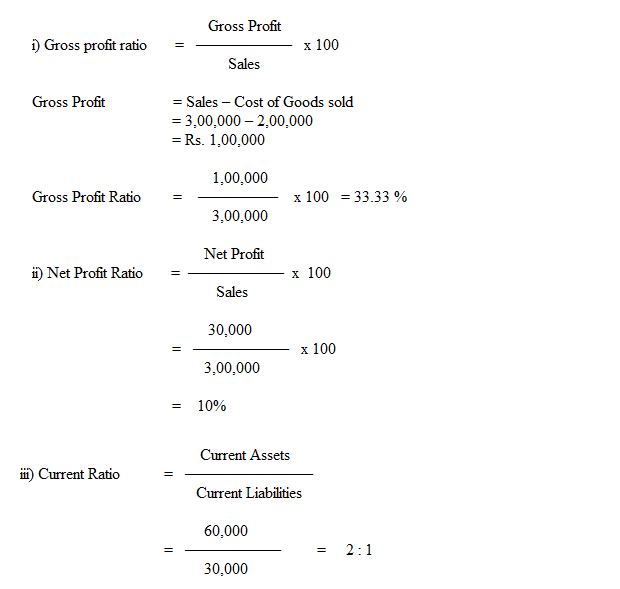
Illustration :
From the following details calculate
1. Gross Profit Ratio
2. Net Profit Ratio
3. Stock Turnover Ratio
4. Debtors Turnover Ratio
Rs.
Sales 1,50,000
Cost of Goods Sold 1,20,000
Opening Stock 29,000
Closing Stock 31,000
Debtors 15,000
Administration Expenses 15,000
Solution :
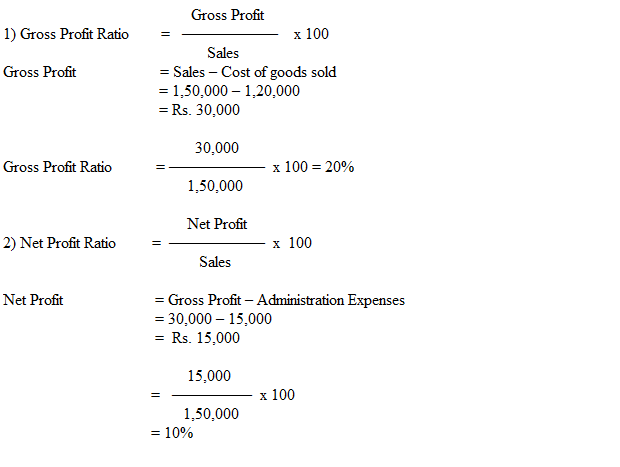
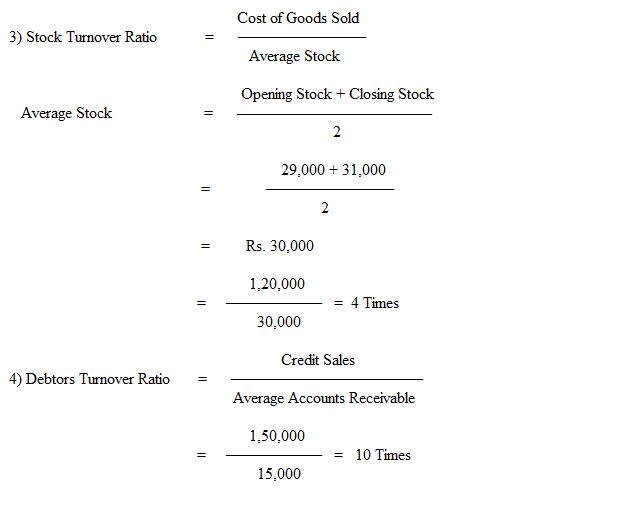
Illustration :
From the Balance Sheet given below, calculate Current Ratio & Proprietory Ratio.
Balance Sheet of Ram & Co. Ltd. as on 31.3.2004
| Liabilities | Rs. | Assets | Rs. |
| Share Capital | 60,000 | Fixed Assets | 1,65,000 |
| Reserves | 45,000 | Current Assets | 75,000 |
| Bank overdraft | 70,000 | Investments (long term) | 35,000 |
| Current liabilities | 1,20,000 | Preliminary expenses | 10,000 |
| Goodwill | 10,000 | ||
| 2,95,000 | 2,95,000 |
Solution :
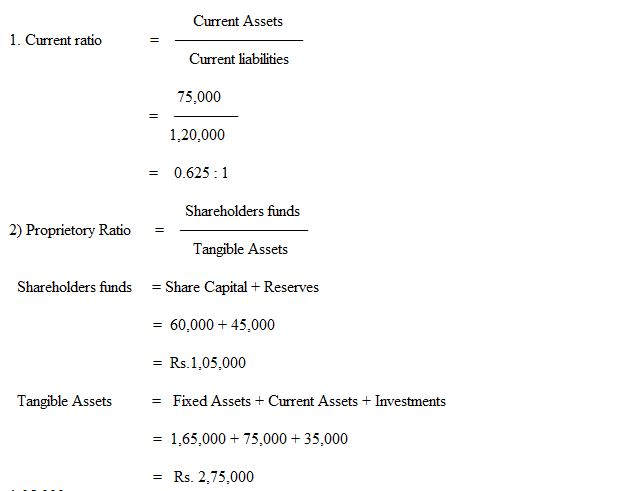
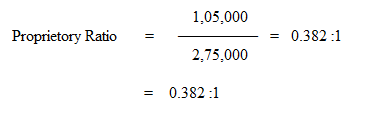
Illustration :
Surya Ltd. provides the following information for the year ending 31.3.05. Calculate Gross Profit ratio, Net profit ratio, Operating profit ratio and Operating ratio.
| Rs. | Rs. | ||
| Sales | 2,00,000 | Gross Profit | 80,000 |
| Office Expenses | 6,000 | Selling Expenses | 4,000 |
| Finance expenses | 3,000 | Loss on sale of plant | 400 |
| Interest received | 500 | Net Profit | 67,100 |
Solution:
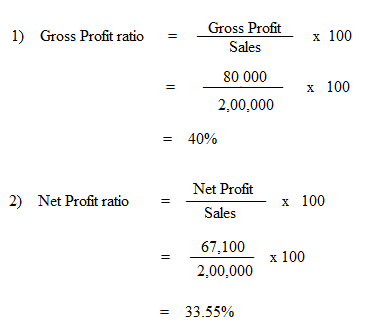
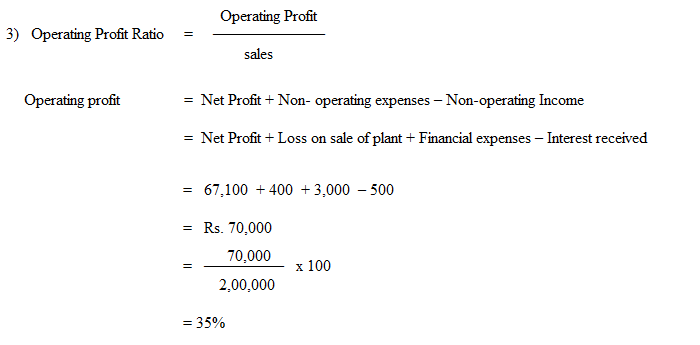
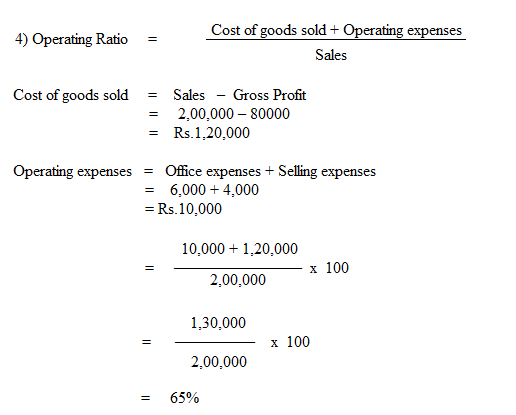
Illustration :
From the following Profit and Loss Account of a company, ascertain the following ratios.
1. Gross Profit Ratio
2. Net Profit Ratio
3. Operating Ratio
4. Operating Profit Ratio
5. Stock Turnover Ratio
Trading and Profit & Loss Account for
Dr. the year ending 31.3.2005 Cr.
| Particulars | Rs. | Particulars | Rs. |
| To Opening Stock | 10,000 | By Sales | 56,000 |
| To Purchase | 44,000 | By Closing stock | 10,000 |
| To Gross Profit | 20,100 | ________ | |
| 66,000 | 66,000 | ||
| To Administration expenses | 2,000 | By Gross Profit | 20,100 |
| To Selling expenses | 8,900 | By Dividend | 1,000 |
| To Interest | 3,000 | By Profit on sale of investments | 800 |
| To Net Profit | 8,000 | ________ | |
| 21,900 | 21,900 |
Solution:
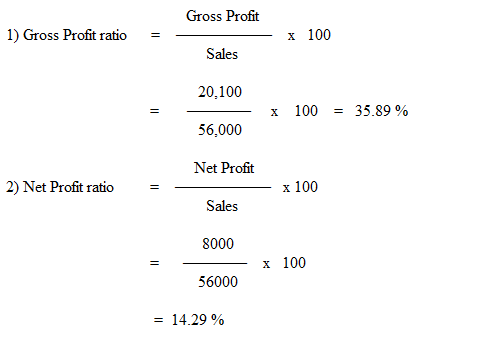
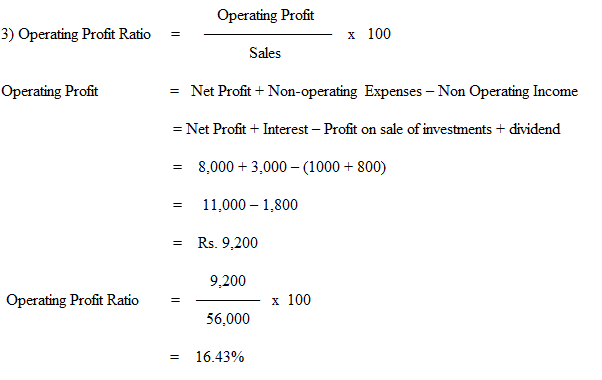
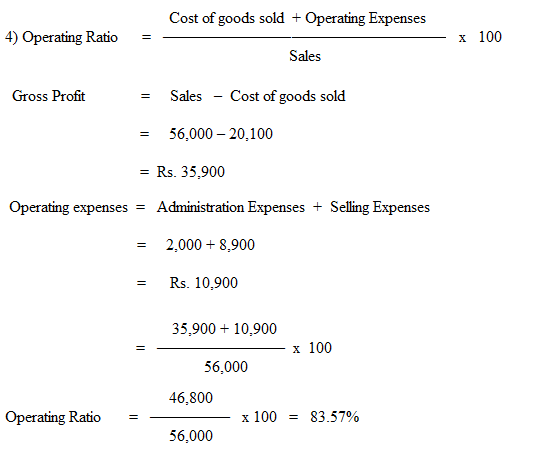
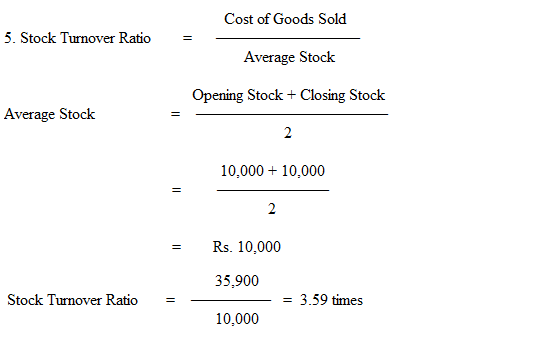
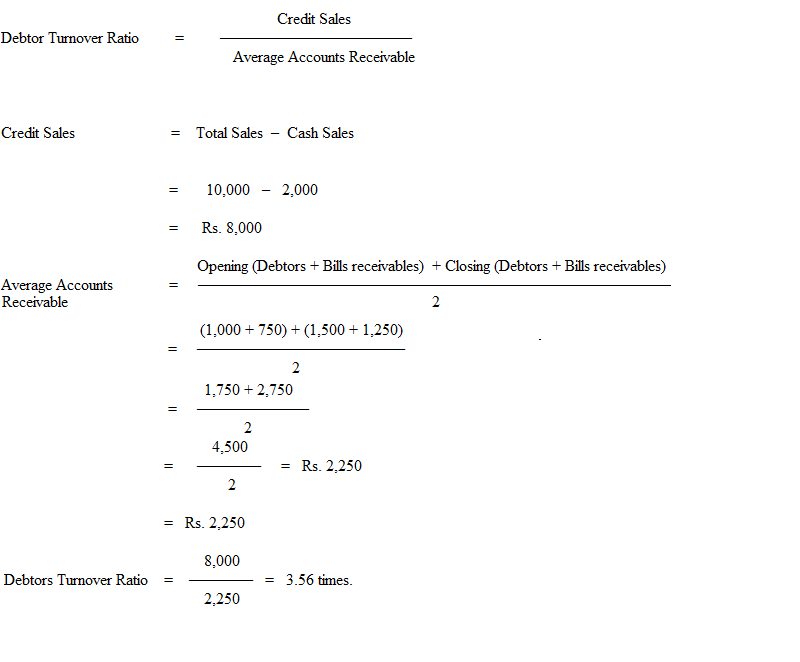
Illustration :
Calculate Debtors turnover ratio from the following.
| Total Sales | 10,000 | Cash Sales | 2,000 |
| Opening Debtors | 1,000 | Closing Debtors | 1,500 |
| Opening Bills Receivable | 750 | Closing Bills Receivable | 1,250 |
Solution :